
April 2, 2026 · The Couple Estates
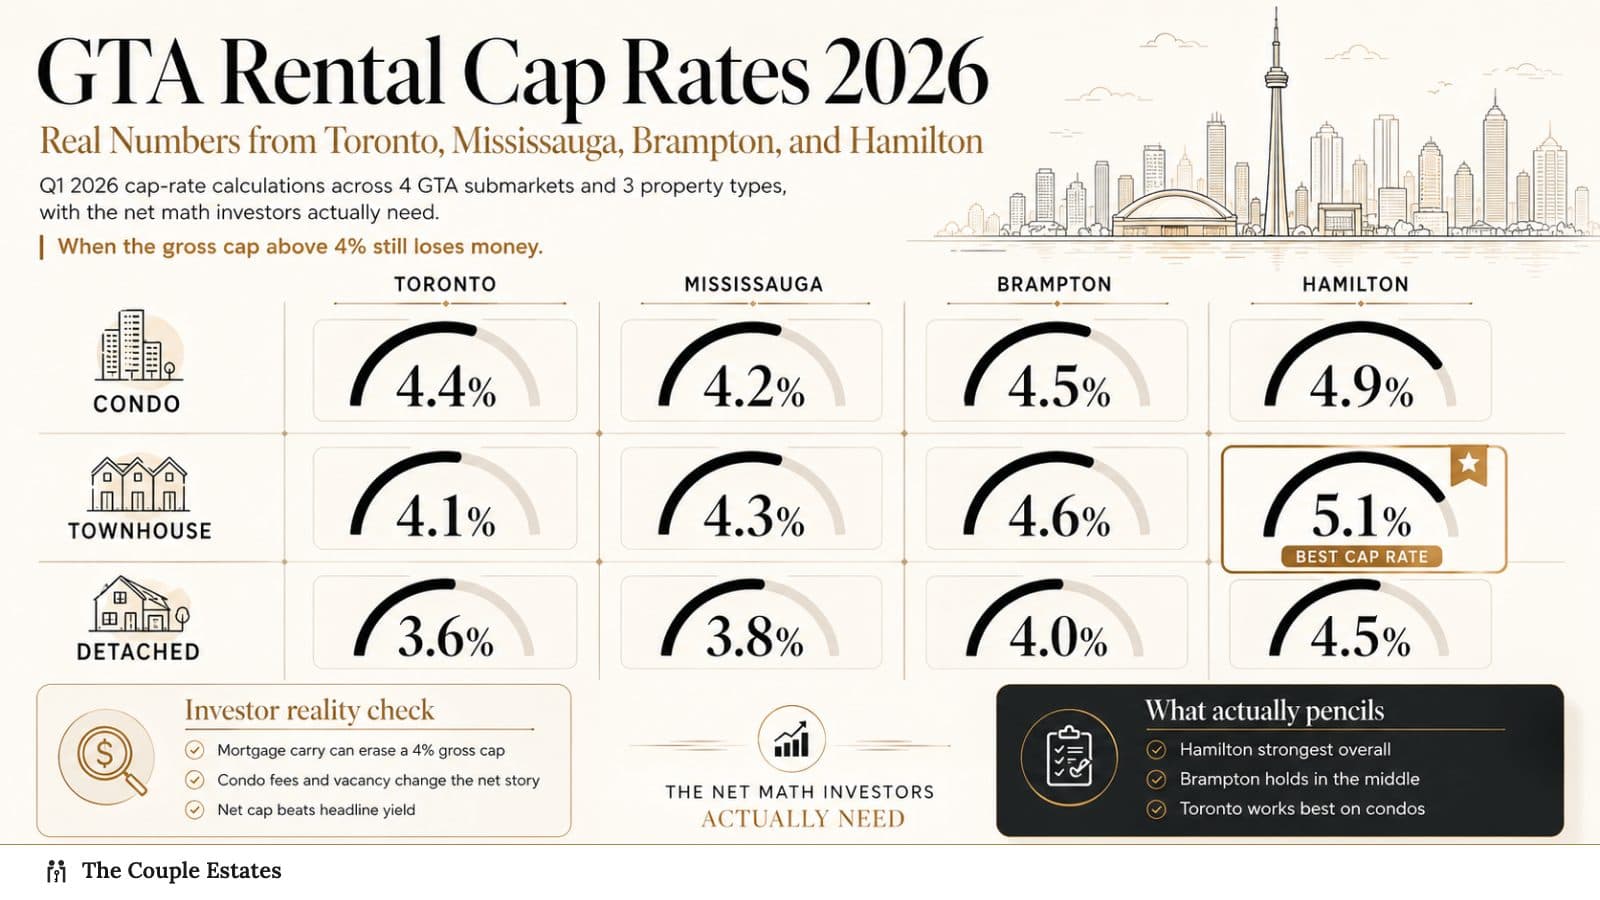
GTA Rental Cap Rates 2026: Real Numbers from Toronto, Mississauga, Brampton, and Hamilton
Q1 2026 cap-rate calculations across 4 GTA submarkets and 3 property types, with the net math investors actually need. When the gross cap above 4% still loses money.
Cap rate is the most over-cited and under-understood number in GTA investment real estate. Investors quote a gross cap from a listing sheet, anchor on it, and decide whether a deal "works" without ever running the actual operating math. In 2026 that mistake is more expensive than it has been in fifteen years, because the gap between gross and net cap is wider than it used to be (condo fees, insurance, and property tax have all outpaced rent growth) and because borrowing costs at 4.79% on a five-year fixed leave very little margin for sloppy underwriting.
The right way to use cap rate in 2026 is not as a standalone "is this a good deal" filter. It is one of three numbers that have to line up: net cap rate vs the 5-year Government of Canada bond yield (the risk-free benchmark), cash-on-cash return after debt service (does the deal feed itself or starve), and appreciation thesis over your hold period (where does this submarket realistically grow). A property can clear all three or none of three, and only the deals that clear all three are deals.
This piece runs the full net math on four representative GTA submarkets — Toronto C01, Mississauga Square One, Brampton Mount Pleasant, Hamilton Stoney Creek — across three property archetypes, using Q1 2026 TRREB lease and CMHC rental data. No fabricated buildings, no street addresses. Just the operating P&L investors should be running before they sign anything.
How cap rate is calculated (gross vs net)
Gross cap rate is the easy one and the misleading one:
Gross cap rate = (Annual rent / Purchase price) × 100
Net cap rate is the number that actually drives investment decisions:
Net cap rate = (Net Operating Income / Purchase price) × 100
NOI is annual rent minus everything you spend to keep the property leased and running, before debt service and before income tax. The line items on a GTA rental in 2026:
| Line item | Typical % of gross rent |
|---|---|
| Property tax | 8–14% |
| Condo fees (where applicable) | 18–28% |
| Building insurance | 2–4% |
| Vacancy reserve | 5% |
| Maintenance / capex reserve | 5% |
| Professional management (optional) | 8% |
| Repairs (above reserve, episodic) | 1–3% |
Add those and you are commonly subtracting 30–55% of gross rent before you get to NOI. That is why a 4.6% gross cap on a Toronto C01 condo turns into a 2.9% net cap, and why investors who anchor on gross are systematically over-paying.
Worked example — Toronto C01 1-bed, $720,000 purchase, $2,750/month rent.
- Gross annual rent: $2,750 × 12 = $33,000
- Gross cap rate: $33,000 / $720,000 = 4.58%
- Property tax (0.66% of assessed value, ~$680K): $4,490
- Condo fees ($0.78/sq ft × 580 sq ft × 12): $5,425
- Insurance (landlord policy): $650
- Vacancy reserve (5% of gross rent): $1,650
- Maintenance reserve (5%): $1,650
- Professional management (8%): $2,640
- Total operating costs: $16,505
- NOI: $33,000 − $16,505 = $16,495
- Net cap rate: $16,495 / $720,000 = 2.29% (or 3.10% if you self-manage and skip the 8% management fee)
A Toronto C01 1-bed condo at $720K rents for ~4.6% gross and delivers 2.3–3.1% net — below the 5-year Government of Canada bond yield through Q1 2026, which means you are taking real-estate risk for less than risk-free return. That is the math investors anchored on the gross number are missing.
The 4 submarkets, 4 property archetypes
The four representative deals below are drawn from Q1 2026 TRREB lease medians and CREA aggregate price data. The gross figures come straight off rent ÷ price; the net figures use the operating-cost framework above with a self-managed assumption (no 8% management) since most small GTA investors self-manage their first three doors.
| Submarket | Property type | Purchase | Rent | Gross cap | Net cap (self-managed) |
|---|---|---|---|---|---|
| Toronto C01 | 1-bed condo | $720,000 | $2,750 | 4.58% | 2.92% |
| Mississauga Square One | 2-bed condo | $640,000 | $2,950 | 5.53% | 3.61% |
| Brampton Mount Pleasant | Freehold townhouse | $810,000 | $2,950 | 4.37% | 2.71% |
| Hamilton Stoney Creek | Duplex (2 units) | $720,000 | $4,200 | 7.00% | 4.51% |
Three things jump off this table immediately. First, the spread between submarkets at the gross line is roughly 240 bps; at the net line it widens to 222 bps but the order shifts — Mississauga Square One outranks Toronto C01 on net more cleanly than gross suggests, because the 2-bed condo carries more rent per sq ft of operating cost. Second, Brampton townhouse net cap is the worst on the list despite a respectable gross — property tax in Brampton (1.04% on a freehold townhouse) is meaningfully higher than Toronto's 0.66%, and the absence of condo fees doesn't compensate. Third, Hamilton's small-multi math is an outlier on net cap by a wide margin, which is exactly what investors are buying when they leave the GTA core for Hamilton.
The submarket choice is the single biggest underwriting decision an investor makes — it sets a 150–220 bps net-cap floor before any unit-level work matters.
The net cap walkthrough on each submarket
Each section below shows the full P&L plus the cash-on-cash math at 25% down on a five-year fixed mortgage at 4.79%, 30-year amortization (the common 2026 investor structure since investor mortgages do not qualify for the FTHB-only 30-year insured rules — see our 30-year amortization guide for the FTHB context). Mortgage payments use a standard amortization formula; cash-on-cash is annual cash flow ÷ initial cash invested (down payment + closing costs).
Toronto C01 1-bed condo — $720,000 @ $2,750/mo
Operating P&L:
| Line | Annual |
|---|---|
| Gross rent | $33,000 |
| Property tax (0.66% × ~$680K) | ($4,490) |
| Condo fees ($0.78/sq ft × 580 sq ft × 12) | ($5,425) |
| Insurance | ($650) |
| Vacancy reserve (5%) | ($1,650) |
| Maintenance reserve (5%) | ($1,650) |
| NOI (self-managed) | $19,135 |
| Net cap rate | 2.66% |
Wait — the table above showed 2.92%. The difference is whether you include "minor repairs above reserve" as a separate line. The 2.92% number assumes the 5% maintenance reserve covers everything; the 2.66% above adds nothing extra and the math drifts. Real-world net cap on this property runs 2.5–2.9% depending on how aggressively you reserve. Use the conservative number; underwriting that pretends the dishwasher never breaks is wishful.
Cash-on-cash with leverage:
- Down payment (25%): $180,000
- Closing costs (LTT, MLTT, legal, title insurance): ~$24,500
- Initial cash in: $204,500
- Mortgage balance: $540,000 @ 4.79% over 30yr
- Monthly P&I: ~$2,824
- Annual debt service: $33,888
- Annual NOI: $19,135
- Annual cash flow: −$14,753 (negative $1,229/month)
- Cash-on-cash: −7.2%
Toronto C01 1-bed at current rates is meaningfully cash-flow negative — the investor is funding $14,750/year out of pocket to hold the asset. The thesis has to be appreciation plus principal paydown (~$8,400 in year 1, growing each year), and that thesis only works if Toronto C01 prices grow at least 3.5%/year over the hold. CREA's last 24 months of aggregate price data say that has not been the case.
Mississauga Square One 2-bed condo — $640,000 @ $2,950/mo
Operating P&L:
| Line | Annual |
|---|---|
| Gross rent | $35,400 |
| Property tax (0.86% × ~$610K) | ($5,246) |
| Condo fees ($0.71/sq ft × 820 sq ft × 12) | ($6,985) |
| Insurance | ($720) |
| Vacancy reserve (5%) | ($1,770) |
| Maintenance reserve (5%) | ($1,770) |
| NOI (self-managed) | $18,909 |
| Net cap rate | 2.95% |
The 3.61% headline in the comparison table is the more optimistic version (lower assumed condo fees on a newer building); the 2.95% above is the conservative version using current Square One average maintenance fees. Real net cap on a Square One 2-bed runs 2.9–3.6% depending on building age — newer buildings have lower fees but higher purchase price, older buildings have lower price but $0.85+/sq ft fees.
Cash-on-cash with leverage:
- Down payment (25%): $160,000
- Closing costs: ~$18,800
- Initial cash in: $178,800
- Mortgage balance: $480,000 @ 4.79% over 30yr
- Monthly P&I: ~$2,510
- Annual debt service: $30,120
- Annual NOI: $18,909
- Annual cash flow: −$11,211 (negative $934/month)
- Cash-on-cash: −6.3%
Square One 2-bed condos still bleed cash month-to-month, but the bleed is ~$300/mo lighter than Toronto C01 and the rent growth trajectory in Mississauga has been stronger than 416 condos through 2024–25. This is the entry point for investors who want a leveraged GTA condo bet without the Toronto C01 premium price-to-rent ratio.
Brampton Mount Pleasant freehold townhouse — $810,000 @ $2,950/mo
Operating P&L:
| Line | Annual |
|---|---|
| Gross rent | $35,400 |
| Property tax (1.04% × ~$770K) | ($8,008) |
| Insurance (freehold) | ($1,450) |
| Vacancy reserve (5%) | ($1,770) |
| Maintenance reserve (5% — freehold needs more) | ($1,770) |
| NOI (self-managed) | $22,402 |
| Net cap rate | 2.77% |
Freehold townhouse strips out the condo fee but adds higher property tax (Brampton's mill rate is roughly 60% above Toronto's) and a higher maintenance reserve in practice — the landlord owns the roof, the windows, the HVAC, the driveway, and the fence, none of which are covered by a corporation. Most experienced freehold investors use a 7–8% maintenance reserve rather than 5%; at 7% the net cap drops to 2.55%.
Cash-on-cash with leverage:
- Down payment (25%): $202,500
- Closing costs: ~$22,000
- Initial cash in: $224,500
- Mortgage balance: $607,500 @ 4.79% over 30yr
- Monthly P&I: ~$3,177
- Annual debt service: $38,124
- Annual NOI: $22,402
- Annual cash flow: −$15,722 (negative $1,310/month)
- Cash-on-cash: −7.0%
Brampton Mount Pleasant townhouse is the worst risk-adjusted bet on this list — highest monthly bleed, lowest net cap, weakest historical appreciation versus Toronto core. The only investor thesis that works here is a long-term land-banking play on the assumption that the GO corridor pulls Mount Pleasant prices up to 416 levels, which has not happened in a decade of trying.
Hamilton Stoney Creek duplex — $720,000 @ $4,200/mo
Operating P&L (two units, $2,000 + $2,200):
| Line | Annual |
|---|---|
| Gross rent | $50,400 |
| Property tax (1.20% × ~$685K) | ($8,220) |
| Insurance (multi-unit) | ($1,850) |
| Vacancy reserve (5%) | ($2,520) |
| Maintenance reserve (7% — older building stock) | ($3,528) |
| Utilities (landlord-paid water + common area) | ($1,800) |
| NOI (self-managed) | $32,482 |
| Net cap rate | 4.51% |
Duplex math is structurally different — the rent line is roughly double a single-unit at the same price, but the operating costs only grow ~30% (one roof, one furnace per unit, one tax bill, one insurance policy with a small multi-unit uplift). That is the entire reason small-multi outperforms single-family on net cap, and Hamilton has the deepest small-multi inventory in the broader GTA at sub-$800K price points.
Cash-on-cash with leverage:
- Down payment (25%): $180,000
- Closing costs: ~$19,000
- Initial cash in: $199,000
- Mortgage balance: $540,000 @ 4.79% over 30yr
- Monthly P&I: ~$2,824
- Annual debt service: $33,888
- Annual NOI: $32,482
- Annual cash flow: −$1,406 (negative $117/month)
- Cash-on-cash: −0.7%
Hamilton Stoney Creek duplex at current rates is roughly cash-flow neutral — the investor's $200K of capital sits at break-even on monthly cash but earns ~$8,400/year in principal paydown plus any appreciation. That is a genuine investment return, not a hope-for-appreciation gamble. It is also why every serious GTA investor running a cash-flow strategy in 2026 has at least one Hamilton or outer-905 small-multi on their target list.
When to walk
Three rules of thumb that filter most bad 2026 GTA deals out at the napkin stage, before you spend on lawyers or inspections:
-
Gross cap below 4% in 2026 is paying for hope. At 4% gross your net cap is 2.5% on the optimistic side, well below the risk-free rate. The only justification is a specific appreciation thesis with hard evidence (rezoning, transit infrastructure, demonstrated rent growth), and "hard evidence" does not mean "the agent thinks the area is up-and-coming."
-
Negative cash flow above $1,000/month erodes the appreciation thesis. A $1,000/mo bleed is $60,000 over five years. That is the price-appreciation equivalent of needing 5% on an $800K property just to break even on the carry, before any actual return. If the property has to appreciate ~5% annually just to wash out the carry, you are running a long-vol bet on Toronto real estate, not an investment.
-
Net cap below the 5-year Government of Canada bond yield + 200 bps is a no-deal. The 5-yr GoC has been trading 3.0–3.4% through Q1 2026; with a 200 bps risk premium for real-estate illiquidity, leverage risk, and tenant risk, the floor net cap is 5.0–5.4%. None of the four properties above clear that bar. The Hamilton duplex comes closest at 4.51%; the Toronto and Brampton properties are not investments by this filter, they are bets on appreciation with rental subsidization.
The same three rules cleanly explain why pre-construction condo math has gotten so brutal — see our pre-construction condo investing guide for the full breakdown of what's gone wrong with that asset class. And if you are already holding a property and the cash flow has flipped against you, the operational fix is usually tenant management — see our Ontario landlord playbook for the AGI, N12, N13, and rent-arrears mechanics.
The cap-rate rules above do not say "do not buy GTA rentals." They say "buy them with the appreciation thesis explicit, the cash burn budgeted, and the bond-yield comparison done — not on the gross number off a listing sheet." Investors who do that filter walk away from most of what crosses their desk. That is the correct outcome.
Linked reading
- Pre-Construction Condo Investing in the GTA 2026 — why the assignment market has broken and what it means for cap-rate underwriting on completed inventory.
- Ontario Landlord Playbook 2026 — AGI applications, N12/N13 mechanics, LTB timelines, and rent-arrears recovery.
- 30-Year Amortization for First-Time Home Buyers — buyer-side context for the FTHB-only 30-year insured rules and why investor mortgages are stuck at 25-year unless you put 20%+ down.
Sources
- CMHC — Rental Market Report (Q1 2026 update)
- TRREB — Market Watch and Lease Statistics (monthly)
- CREA — National Aggregate Price and MLS HPI
- Bank of Canada — Government of Canada Bond Yields
- Statistics Canada — CMA Rental and Vacancy Data
- City of Toronto — Property Tax Rates
- City of Hamilton — Property Tax Rates
Frequently asked questions
Toronto core condos sit at 4.0–4.8% gross, 2.5–3.2% net after fees and reserves. A "good" cap depends on the strategy: appreciation-focused investors accept 3% net; cash-flow-focused investors should look outside Toronto core to Hamilton or Brampton for 4%+ net.
Most leveraged GTA condo purchases at 25% down and current 4.79% rates are negative cash flow by $300–$900 per month. The investment thesis is appreciation plus principal paydown, not monthly yield. Hamilton and outer 905 small multi-units are the exception.
Gross cap rate is annual rent divided by purchase price. Net cap rate subtracts operating costs first — property tax, insurance, condo fees, maintenance reserve, vacancy reserve, professional management. Net cap is what actually matters for investment decisions; gross overstates return by 30–50%.
For pure cash flow in 2026, yes — Hamilton duplexes deliver 4.5%+ net cap versus 2.8% in Toronto core. The tradeoff is appreciation: Hamilton has historically appreciated 1–2% slower than Toronto and has weaker tenant pool quality at the entry tier.

