
April 7, 2026 · The Couple Estates
GTA Market Report — March 2026: Sales Up 1.7%, First Year-Over-Year Gain in Six Months
TRREB's March 2026 Market Watch, released April 7, 2026, shows GTA home sales rose 1.7% year-over-year — the first positive print in six months. Average price slipped to $1,017,796. Here's what changed and what to watch into spring.
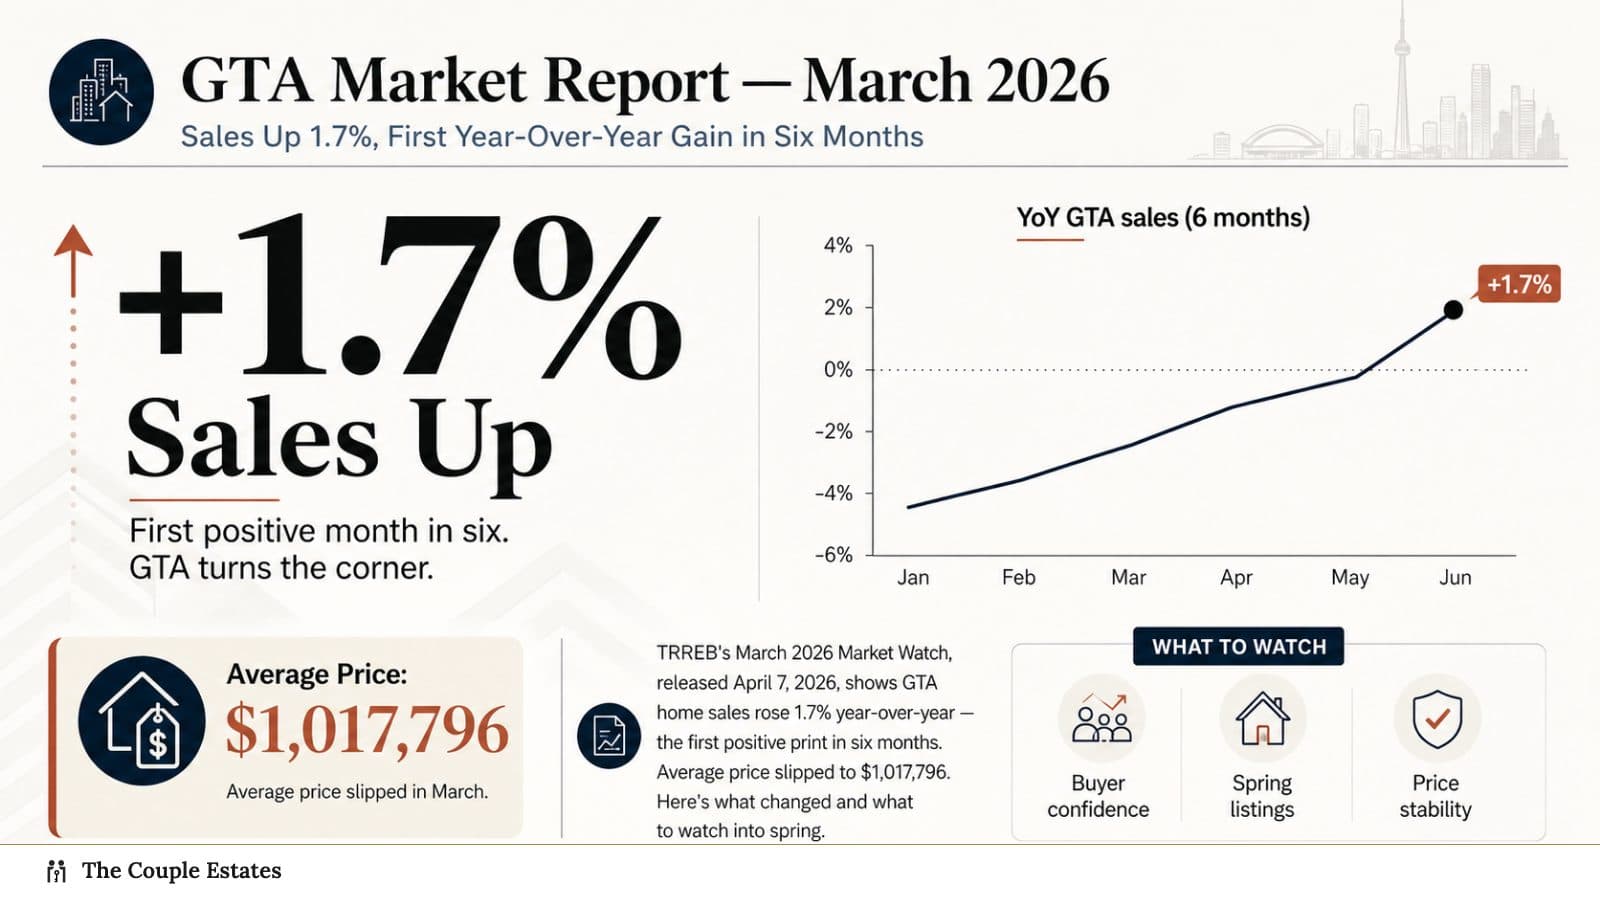
TRREB released its March 2026 Market Watch this morning, and for the first time in six months, GTA home sales posted a year-over-year gain.
Not a huge one — 1.7% — but given the relentless negative prints since last summer, a positive sign is a positive sign. Meanwhile, the average selling price ticked down to $1,017,796, off 6.7% from March 2025 but up slightly from February.
Here is the data, what drove the shift, and what to expect as the spring market gets going.
March 2026 at a glance
| Metric | March 2026 | March 2025 | YoY change |
|---|---|---|---|
| Home sales | 5,039 | 4,953 | +1.7% |
| Average selling price | $1,017,796 | $1,090,786 | −6.7% |
| MLS HPI Composite benchmark | — | — | −7.4% |
| New listings | 14,442 | 17,339 | −16.7% |
 GTA monthly home sales YoY change, showing the first positive print (+1.7%) in six months. Source: TRREB Market Watch.
Why sales turned positive
Two things changed between February and March.
1. Sellers stopped flooding the market. New listings fell 16.7% year-over-year in March — a meaningful pullback in supply. Owners who were planning to list this spring either paused or decided to wait until after the Carney–Ford housing announcement (which landed on March 30). Less new inventory hitting the board meant buyers were chasing a slightly thinner slate of options, and fence-sitters moved.
2. Softer prices finally mattered. Average prices are now roughly 7% below peak year-ago levels. For a cohort of buyers who were pre-approved at 2024 incomes but held off through 2025, that 7% discount plus stable rates is the trigger that gets them off the sidelines. TRREB explicitly cited this in their release: "lower selling prices compared to March 2025 helped with affordability moving into the spring market."
The combined effect: mild tightening of market conditions in March. Not a boom, not a reversal — a step toward balance after a year of leaning heavily buyer-favored.
The bigger picture
A quick look at the three-month trend:
| Month (2026) | Sales | Avg price | YoY sales | YoY price |
|---|---|---|---|---|
| January | 3,082 | $973,289 | −19.3% | −6.5% |
| February | 3,868 | $1,008,968 | −6.3% | −7.1% |
| March | 5,039 | $1,017,796 | +1.7% | −6.7% |
Sales volume has stepped up in each successive month — normal seasonal pattern, but accelerating. Average price has stabilized in a tight band around $1.00M–$1.02M. That stabilization is the story. The market is not collapsing further; it is consolidating.
Where the market is tightening — and where it still isn't
Sub-market heat map for March:
Tightening fastest:
- Halton (Oakville, Burlington, Milton) freehold — supply tight, sale-to-list ratios nearing 100%.
- Durham (Whitby, Ajax, Pickering) detached — best YoY price support in the GTA.
- Brampton / Mississauga detached — strong first-time and move-up buyer demand reacting to HST rebate news.
- Vaughan freehold — end-user buyers returning.
Still soft:
- Downtown Toronto condo (C01) — benchmark down 9%+ YoY, elevated inventory.
- Mississauga / Square One condo — investor-heavy, continued weakness.
- North Oakville / northeast Brampton new-build — direct competition with discounted pre-construction under the March 30 Carney–Ford HST measures.
Moving sideways:
- Most 416 east-end freehold (Leslieville, Beaches, Riverdale).
- Midtown Toronto (Yonge-Eglinton corridor) — volume up, prices flat.
- Richmond Hill / Markham freehold — steady.
What spring 2026 looks like from here
Three forecasts worth paying attention to.
Sales: Should continue to drift higher through April and May on normal seasonality plus a tailwind from the March 30 Carney–Ford housing announcement drawing first-time buyers back to new construction. April total sales likely in the 6,000–6,800 range vs. 6,436 in April 2025.
Prices: Mostly stable in the $1.00M–$1.04M band through Q2. The price weakness in YoY comparisons is mostly a base-effect story — we are comparing to a relatively strong April–May 2025. By June, YoY comparisons should start looking better simply because 2025 comps get weaker.
Supply: Watch the April new listings number. If sellers stay cautious and new supply remains down, the tightening we saw in March accelerates. If sellers flood back in — particularly condo sellers — we revert to the overhang dynamic from last fall.
What this means if you're buying right now
Spring is the best chance for the data to signal a bottom — and historically, bottoms are only visible a few months after they pass. If you are waiting for the all-clear siren, you will miss it. Three tactical points:
- Act on well-priced listings that match your criteria. Not every listing is mispriced — the good ones are sharply priced to trigger offers, and they are getting them within 10 days. Don't anchor your view of "what's available" to the stale listings sitting for 60+ days.
- Get your mortgage pre-approval refreshed this month. Rates may drift lower by July. If they do, you want to re-qualify at the lower rate so your budget expands. Rate holds are good for 120 days at most lenders.
- Consider new construction seriously. The Carney–Ford HST removal on agreements signed from April 1, 2026 onward changes the math substantially for new-build purchases. We wrote a full breakdown of the new HST relief here.
What this means if you're selling
List in April or early May. Not June. The Carney–Ford HST relief on new construction will start pulling more buyers into pre-construction by late spring. Resale sellers in new-build-heavy sub-markets (Milton, Oakville North, Brampton NW, East Gwillimbury) want to be on the market before that shift fully lands.
Price sharply. The market rewards listings priced 1–2% below recent comparables with showings and offers. It punishes listings priced at or above comparables with silence.
Stage and photograph professionally. Buyers are selective right now. A listing that looks like a tired home gets skipped in favour of a similar unit that looks move-in ready.
See current GTA listings or reach out to talk through your specific neighbourhood's numbers.
Watchlist for the next 30 days
- April 16: Statistics Canada March CPI release — biggest single input to BoC's next decision.
- April 29: BoC rate decision + Monetary Policy Report. Market is pricing a modest probability of a 25-bp cut.
- May 6: TRREB April Market Watch. Tells us whether the March uptick is the start of a trend or a one-month pop.
March's numbers don't say the GTA is fully back. They do say the downward slide has paused, sellers are rationally pulling back on supply, and buyers are re-engaging at current prices. That's the shape of a market finding its footing.
Questions about a specific property or neighbourhood? Let's talk.
Sources
- TRREB — GTA Homes Sales Up and Selling Prices Down in March
- TRREB Market Data Hub
- CP24 — Home sales up in the GTA, selling price down
- Zoocasa — TRREB March 2026: Average price $1.02M


