
February 4, 2026 · The Couple Estates
GTA Average Home Price Drops Below $1 Million for the First Time Since 2021: TRREB's 2026 Market Outlook
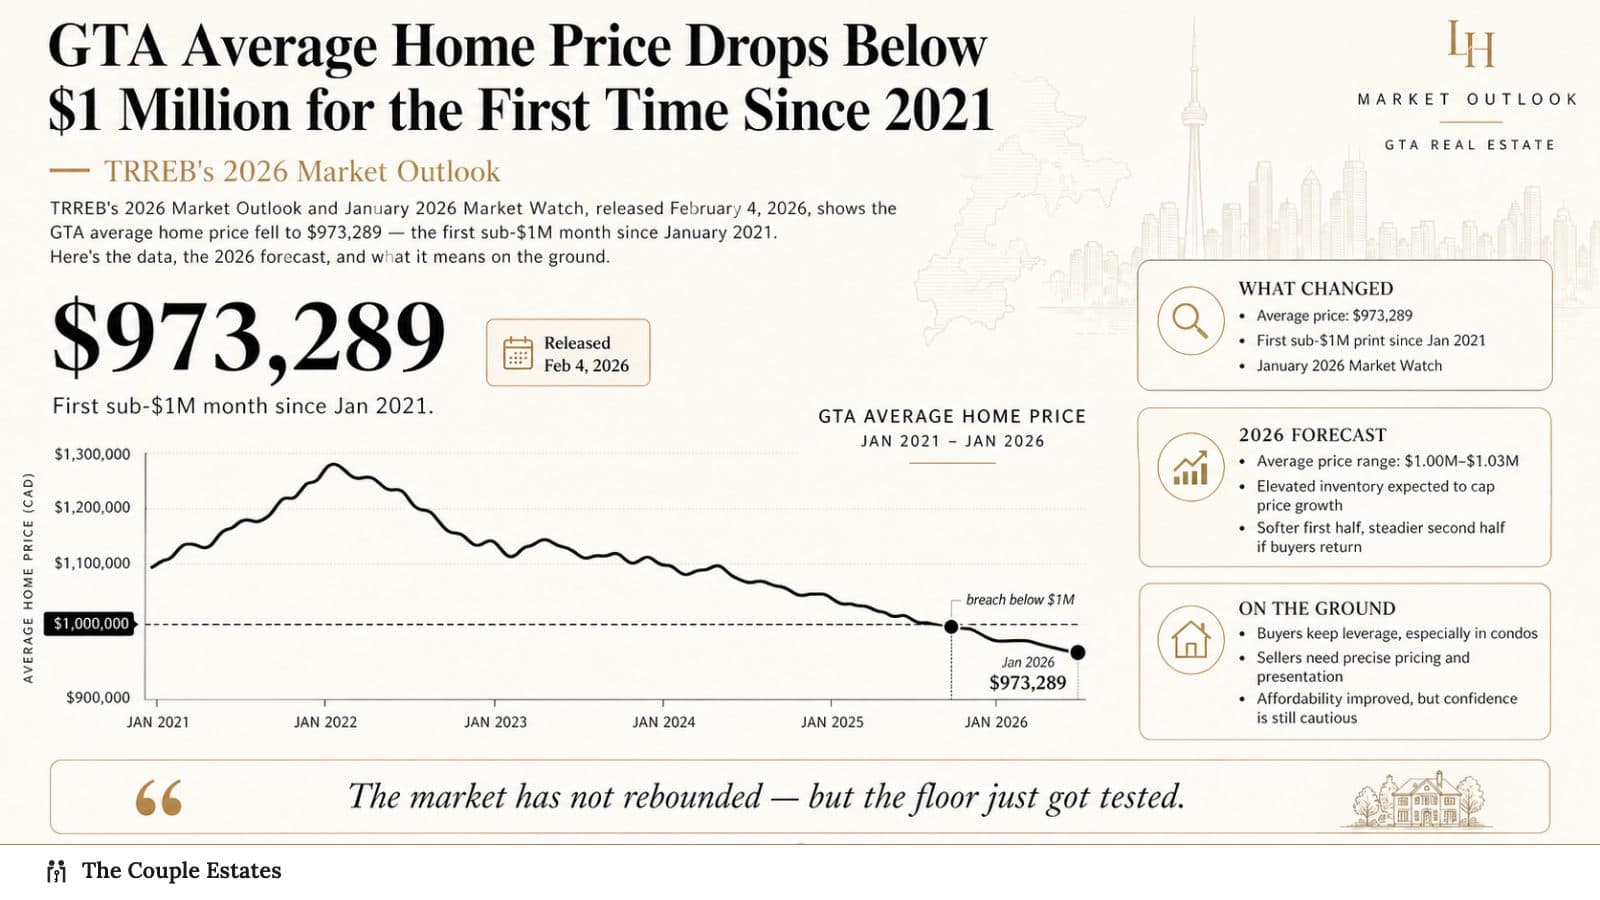
TRREB's 2026 Market Outlook and January 2026 Market Watch, released February 4, 2026, shows the GTA average home price fell to $973,289 — the first sub-$1M month since January 2021. Here's the data, the 2026 forecast, and what it means on the ground.
For the first time since January 2021, the average selling price of a home in the GTA has dropped below $1 million.
TRREB released its 2026 Market Outlook and January 2026 Market Watch this morning, and the headline number — $973,289 — is already all over the business press. It is not a number most GTA homeowners expected to see again this decade.
Here is what the data actually says, where TRREB sees 2026 going, and what it means if you are buying, selling, or holding property in the Greater Toronto Area right now.
The bottom line — January 2026 headline numbers
| Metric | January 2026 | January 2025 | YoY change |
|---|---|---|---|
| Home sales | 3,082 | 3,819 | −19.3% |
| Average selling price | $973,289 | $1,041,488 | −6.5% |
| MLS HPI Composite benchmark | — | — | −8.0% |
| New listings | 10,774 | 12,427 | −13.3% |
And the first below-$1M print since January 2021 — a symbolic line that has been moving through the GTA's collective psyche for years.
 GTA monthly average selling price, with the January 2026 print of $973,289 marking the first sub-$1M month in five years. Source: TRREB Market Watch.
What January actually tells us
Three things. None of them particularly pleasant for sellers.
1. Sales fell off a cliff. Down 19.3% year-over-year in a market that was already weak. This is the slowest January for GTA sales since at least 2018. Buyers are sitting on their hands because they correctly read (a) rates might still fall further and (b) inventory is not going anywhere.
2. Inventory is still heavy, but new supply cooled. Active listings remain well above historical norms — particularly in condos — but new listings are down 13.3% as sellers pull back rather than accept softer pricing. That restraint is what's keeping the bottom from falling further.
3. The average vs. benchmark story is the key. Average selling price is down 6.5%, but the MLS Home Price Index benchmark — which controls for mix shift — is down 8%. That means part of what looks like a "smaller decline" in the average is actually more expensive homes making up a bigger share of what's selling, which masks the true per-property weakness.
Translation: the actual home-for-home price decline is closer to 8% than 6.5%.
TRREB's 2026 forecast
The big-picture forecast from TRREB's research team:
- 2026 average price range: $1.00M – $1.03M. Essentially flat from late-2025 levels, with modest recovery in the back half of the year.
- Sales volume: similar to each of the last three years, roughly 65,000–75,000 transactions across the board.
- First half of 2026: YoY prices likely down, given the easier year-ago comps.
- Second half of 2026: stabilization "if buyers start moving off the sidelines and market conditions tighten."
The key conditional in TRREB's forecast is "if." There are two plausible scenarios for the next 9 months:
Scenario A — Slow stabilization. BoC cuts 25 bps once more in spring, inflation stays contained, US tariff noise fades, buyers gradually return. Prices bottom around late Q2 and edge up from there. 2026 closes at ~$1.00M average, down roughly 2% from 2025.
Scenario B — Continued softness. Tariffs deepen, unemployment drifts to 7%+, rates stay at 2.25% but consumer confidence stays weak. Inventory stays elevated. Prices grind sideways through the year or drift another 3–4% lower. 2026 closes around $950K.
Most forecasters (RBC, TD, BMO, CIBC) are mid-way between these scenarios. Our read: closer to Scenario A than B, but the path is bumpy.
Where the $973,289 actually comes from
The GTA is not a single market. Breaking January's average by property type:
| Type | January 2026 avg | YoY |
|---|---|---|
| Detached | ~$1.30M | −5% |
| Semi-detached | ~$1.05M | −4% |
| Townhouse | ~$900K | −6% |
| Condo apartment | ~$685K | −8% to −10% |
Condos are leading the decline — consistent with the pre-construction story (see our GTA condo crash analysis for more). Freehold properties are holding up better, particularly in established inner-city pockets.
And by region, the pattern is familiar:
- City of Toronto: softest, especially downtown condo and east-end freehold.
- Peel (Brampton, Mississauga): mixed — Mississauga condo weak, Brampton freehold holding up.
- York (Vaughan, Richmond Hill, Markham): Vaughan condo relatively resilient thanks to VMC transit; freehold flat.
- Halton (Oakville, Burlington, Milton): the strongest sub-market, with Oakville freehold near flat YoY.
- Durham (Whitby, Ajax, Pickering, Oshawa): generally positive — better value migration from 905 core.
What this means if you're a buyer
You have more leverage than at any point in the last five years. Two specific things are different right now than they were 12 months ago:
- Time. The days-on-market average has extended materially. In most sub-markets outside of core Toronto freeholds, you have 5–10 days to think about a property before someone else takes it. That is not a 2021 environment.
- Selection. Active listings are up across nearly every sub-market. You can be choosy about floor plans, orientation, and specific street on a street-by-street basis — not scramble for whatever comes available in the neighbourhood.
The catch: mortgage affordability is still the binding constraint, even with softer prices. A $900K home at 4.29% fixed on a 25-year amortization requires roughly $5,100/month — and after closing costs, the effective entry price is higher than the sticker suggests. Use our search filters to dial in on price ranges that actually match your qualified mortgage budget.
What this means if you're a seller
Three things to internalize.
1. 2024 comps are no longer relevant pricing guides. If your agent is still running comparable sales from 14–18 months ago, you're being mispriced. Your pricing needs to be anchored to sales in the last 60 days, ideally in the last 30.
2. Price for the condition of the home you have, not the home you wish you had. The market is rewarding move-in ready, staged, professionally photographed listings and punishing anything that needs work. Buyers have choice and they are using it.
3. Be realistic about spring. Historically, spring listings outperform. This year, expect that premium to be muted. We are forecasting average GTA spring sale-to-list ratios in the 97–99% range — not the 102–105% of a normal spring.
If you're weighing listing in late February vs. waiting to April, talk to us — the best time depends heavily on your specific property type and sub-market.
What to watch over the next 60 days
- March 5, 2026: TRREB February Market Watch. Will tell us whether January was a floor or a waypoint.
- March 18, 2026: Bank of Canada rate decision. A cut here would materially lift buyer sentiment going into spring.
- April 16, 2026: Statistics Canada March CPI. Inflation trajectory is the biggest single driver of the BoC's next move.
- April 29, 2026: BoC decision + Monetary Policy Report. The meeting most economists think is the earliest realistic window for another cut.
The GTA is in a rare rebalancing year. That's scary if you're a recent seller sitting on a price drop, and exciting if you're a long-time watcher finally ready to buy. Either way, the data says do not expect fireworks either direction in 2026. The story is slow, grinding normalization.
Questions about your specific neighbourhood or property? Drop us a line — happy to pull the live comps and talk through what the data says about your situation.
Sources
- TRREB — GTA Home Sales and Prices Expected to Remain Stable in 2026
- TRREB — January 2026 Market Watch (PDF)
- TRREB Market Data Hub
- BNN Bloomberg — Average GTA home price dropped below $1M in January
- CBC — GTA home sales, prices slide in January


